
An Examination of Excess Mortality Suggests That COVID-19 Is Less Deadly Than the Asiatic Flu of 1958
Brian Murphy, PhD
October 9, 2020
Updated October 30, 2020
Introduction
For the week ending October 3, 2020, the CDC reports that 200,499 people have died of COVID-19. However, the CDC points out that this figure is lower that the figure from other media outlets because of two or more weeks delay in collecting death certificate data. Johns Hopkins reports 213,588 deaths as of October 9, 2020. We also know that both of these figures may be very high due to confusion or uncertainty in assigning the cause of death. We also know that institutions that were financially incentivized to declare COVID-19 as the cause of death, may have done just that, especially in the presence of multiple co-morbidities, any one of which may have been the primary cause of death. In the midst of confusion, there was a financial incentive to choose COVID-19 over other causes. Finally, even without financial incentives and with the best intentions, determining the cause of death in some situations can be clinically difficult to ascertain.
Excess Mortality Defined
The concept of “excess mortality’ is very useful in providing a way of examining death data in a way that is totally free from the complexity of co-morbidities and the errors from financial bias or clinical evaluation in writing death certificates. Excess mortality is the number of deaths that occur in a given time period that exceed the number of deaths that normally can be expected to occur from all possible causes in the same time period. This method assumes that all deaths are counted and that all death certificates represent real deaths, irrespective of the cause. The reason to look at excess mortality of the entire USA is that if it suddenly increases, it might be attributed to the pandemic. If all other factors leading to death such as automobile accidents, homicides, suicides, pneumonia and other causes are relatively constant, one can surmise that excess mortality approximates the actual number of COVID-19 deaths. Or, at least it provides an independent estimate, subject to interpretation.
Beginning Feb 1,2020, as of the week ending on October 3, 2020, the CDC reported 2,167,730 total deaths from all causes (column 3), a number that is usually not disputed. In column 4, they report that this total is 112% of expected deaths for the same period. That means that they have computed the expected deaths to be 1,935,473. The excess mortality is the simple difference in these two numbers, 232,257 or 12% (column 4).
CDC Bias Error
We take serious issue with the CDC’s estimate of projected deaths. As a result, our calculation yields only 6% excess mortality which is half of their estimate of 12%. One can readily appreciate that the estimate of projected deaths is crucially important in this exercise. To estimate the projected mortality rate for the USA in 2020 (without COVID-19), we took the death rate in 2017, 2018 and 2019, years in which the death rate increased by 1.2% each year and linearly extrapolated it to 2020 by multiplying the death rate in 2019 (8.782 per 1000) by 1.012 yielding 8.887. We then multiplied this by the population for the USA in 2020 (331,539,123) yielding a projected number of deaths of 2,946,515 for the entire year. To make a direct comparison with the CDC data it is necessary to reduce the time period to February 1, 2020 (end of the first week of CDC data) until October 3, 2020 (36 weeks). Assuming that the death rate is uniform throughout this period, the projected deaths are 2,039,895, much higher than the CDC number. The resultant excess mortality is 2,167,730 - 2,039.395 = 127,835 (6%) or half of the CDC estimate. This is a huge difference!
The reason for the large discrepancy in computing excess mortality is that the CDC used a different method to calculate projected deaths for 2020. They used the average of the death rates for 2017, 2018 and 2019. This is the time when there was a close to linear increase in the death rate of 1.2 % each year. The CDC compared the death rate to the average of these 3 years i.e. at a time when the death rate had increased approximately 1.8% (1.5 years X 1.2%) from 2017. Yet , if the death rate had kept increasing by 1.2% per year, the death rate in 2020 would be predicted to increase by 3.6% from 2017 (3 years x 1.2% per year - rather than the 1.8% used by the CDC). This method results in the CDC comparing the actual death rate to a lower predicted death rate, resulting in an excess mortality of 12%. Had one compared it to the higher predicted mortality, the excess death rate would only be 6%.
CDC Publishes Excess Mortality
On October 23, 2020, Rossen et al from the CDC published a more detailed analysis of excess mortality entitled "Excess Deaths Associated with COVId-19, by Age, Race and Ethnicity." However, in this article, they averaged five (instead of 3) years of death rates to come up with a projection for 2020, effectively biasing the projection of 2020 deaths even lower and making the excess mortality even higher.
See Table.
| Year | Death Rate/1000 |
Percent Change |
USA 2020 Population |
Projected Deaths at 36 weeks |
Actual Deaths |
Excess Mortality |
Comment |
| 2015 | 8.369 | 1.270 | |||||
| 2016 | 8.475 | 1.270 | |||||
| 2017 | 8.580 | 1.240 | |||||
| 2018 | 8.685 | 1.220 | |||||
| 2019 | 8.782 | 1.120 | |||||
| 2020 | 8.887 | 1.200 | 331,539,123 | 2,039,895 | 2,167,730 | 127,835 | Murphy Projection |
| 2020 | 8.578 | 1.224 | 331,539,123 | 1,968,929 | 2,167,730 | 198,801 | CDC Projection |
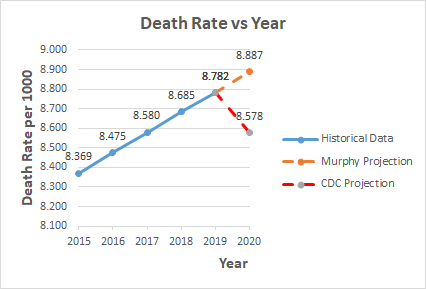
The graph below plots the death rate data from the Table. The graph shows how the death rate was increasing linearly from 2015 to 2019, most likely due to the aging population. This data is taken from Macrotrends historical death rate, wherein one readily sees from their graph that the death rate has been increasing linearly for the past five years. Hence, it is logical to simply extrapolate that rate to 2020 (8.887) as shown by the orange dashed line. The CDC projection is shown by the red dashed line. The projection for 2020 is the average of the death rates from 2015 to 2019 (8.578). It is clear from the graph that this is a significant underestimate. It actually corresponds to the death rate in 2017. It is even much less than the value in 2019 (8.782). To say that the projected death rate in 2020 (without COVID-19), is less than it was in 2019, given the obvious upward trend, is absurd. The authors admit to all the possible sources of error and to the fact that results vary based on different methods of calculation. They are not naïve. Nevertheless, their analysis is seriously biased. Consequently, the excess mortality is closer to 127,835 basedon the Murphy projection.
The CDC analysis also introduces and applies weighting factors, which are described but not specified in detail, to increase the number of actual deaths based on estimates of under-reporting or late reporting. This has the effect of substantially increasing the excess mortality by 100,181 (huge) to 299,028, more than double the Murphy projection of 127,835. Why were there not reduction factors applied to the data in February and March which may have arrived late so that the data actually pertained to an earlier period such as January or December? Wouldn't it be more reasonable to assume that late reporting was uniform from February through October so that the two sources of error, one at the beginning of the measurement window and one at the end would cancel each other out and no weighting would be necessary? So, the CDC projection of excess mortality is again biased by dubious correction factors to death counts, further undermining confidence in the analysis.
Public Policy Implication
We estimate the excess mortality in the USA, for the period of February 1 to October 3, 2020 to be 127,835. The implications of this large discrepancy from the CDC estimate can be substantial in considering public policy. An excess mortality of 127,835 could mean that actual COVID-19 deaths are only 127,835, much less than CDC estimates of 232,257 or 299,028. What other factors could influence the excess mortality making it even less COVID-19 related? Anecdotal evidence suggests that mortality due to non COVID-19 causes has increased during the pandemic. Suicides, drug over doses, delayed cancer diagnoses, delayed cardiovascular therapy, delayed stroke therapy, delays in every health category are possible factors. Pointing out a possible decrease in mortality due to less auto fatalities is valid, but then the possible increase in excess mortality caused by oppressive and irrational government action and generalized fear is also valid. There is no real data to correct for all of these factors. If we assume that they cancel each other out, excess mortality remains our best estimate of COVID-19 deaths - 127,835 for the defined period of February 1 to October 3, 2020.
If we compare the deaths from the Asiatic flu of 1958 (115,000) and prorate that number for a doubling of our population since 1958, to 230,000 deaths, we can conclude that COVID-19, with excess mortality of 127,835 is much less deadly than the Asiatic flu of 1958 when there were no lockdowns, no mask mandates, no mandated disruption of public schools and no mandated major disruption of the economy. We should have done today what we did in 1958 – nothing extreme or out of the ordinary and then improve on that by following this advice: Thousands of medical professionals criticize lockdowns, argue for ‘focused protection’ and a return to normal life